Wall Painting Analysis

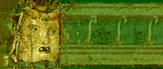
Figure 1. Perspectival analysis.
Key to Figure 1.
- The purple line represents the central axis of perspective.
- Green lines show the extreme top and bottom sections of the structure using the same point of perspective.
- Blue lines show the middle and main core of the structure using a lower single point of perspective.
- The lines of perspective are perfectly symmetrical on each side
of the central axis.
For a brief explanation of perspectival analysis see: de-coding perspective in skenographia